Tutorials
How to analyse a set of breakpoints already present in the database
Example –
Homo sapiens mtDNA deletions associated with Kearns-Sayre Syndrome
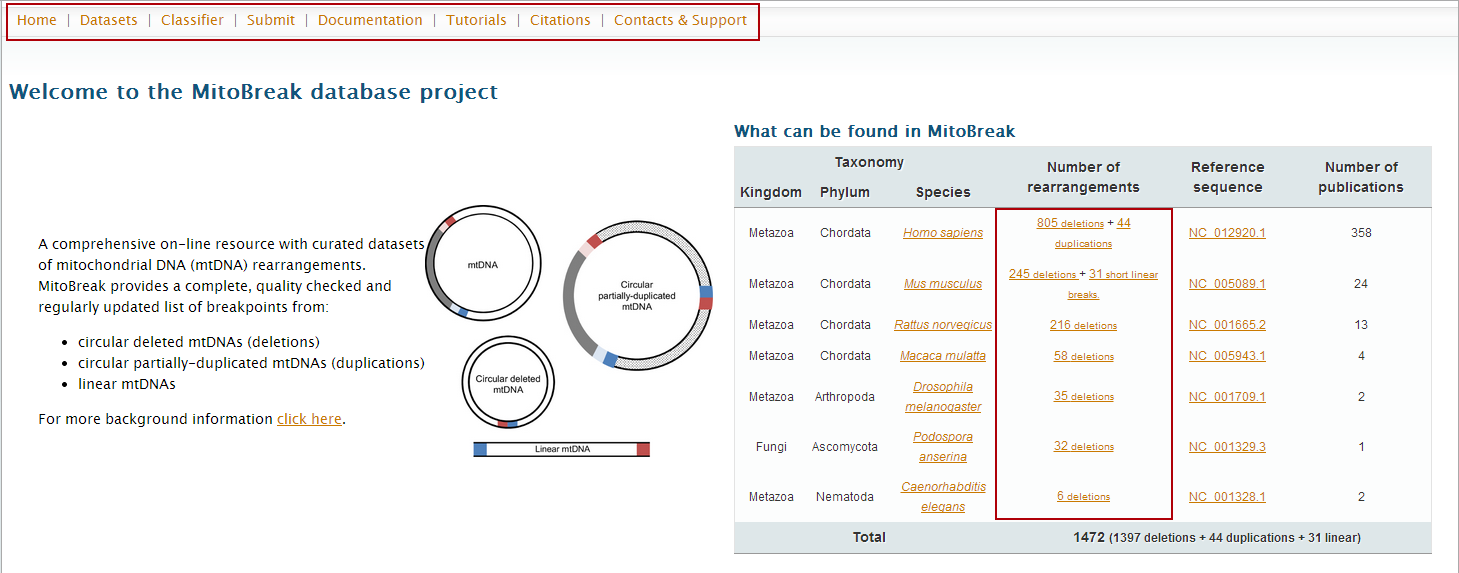
1. Go to
http://mitobreak.portugene.com/
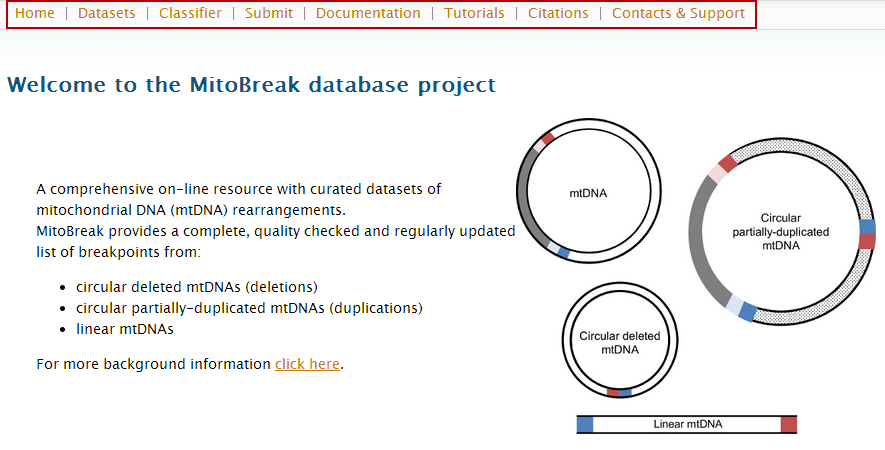
In the main page, you can access all datasets by the "Datasets" button on the top and bottom bars.
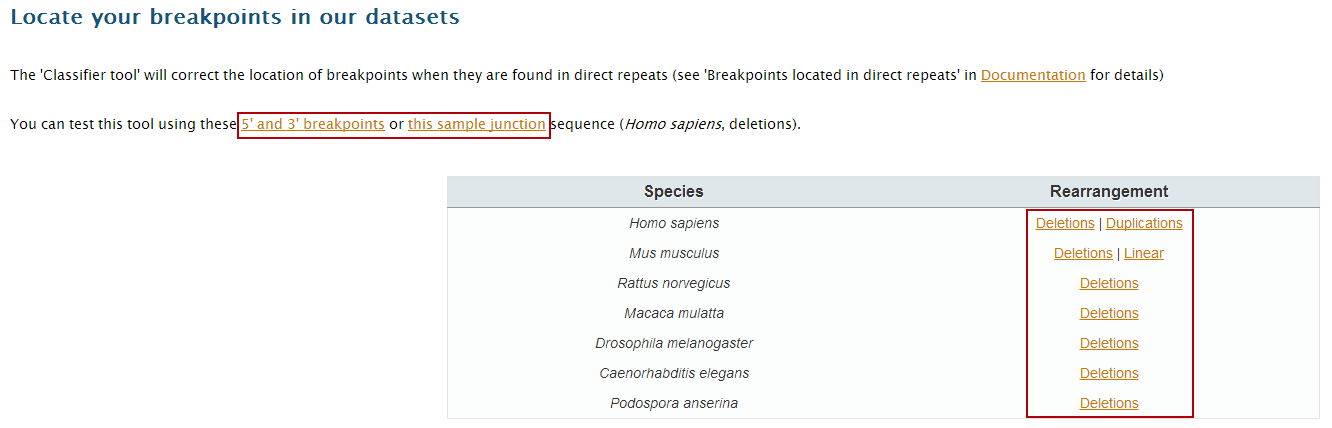
(In alternative, you can go directly to a dataset by clicking on the links present in table ‘What can be found in MitoBreak’. In our example, just click on the "deletions" option for
Homo sapiens, and jump to step 4).
2. Click on "Datasets" either on the top or bottom link bars.
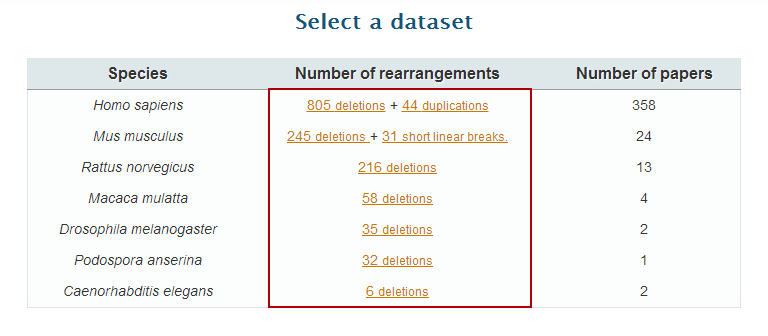
3. Click on "deletions" option on the
Homo sapiens row to open the 'Dataset page'.
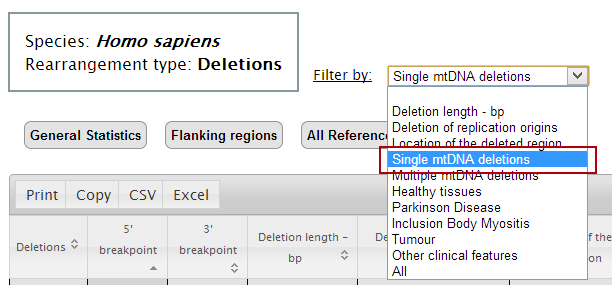
4. Select the first filter to apply to the table. At this point, only deletions associated with the selected filter will be shown in the table.
In our example, select "Single mtDNA deletions", which includes Kearns-Sayre Syndrome.
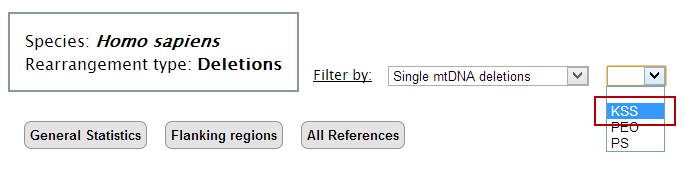
5. Then, select the second filter to the table. Again, only the deletions associated with the selected filter will be shown in the table.
In our example, select "KSS" (Kearns-Sayre Syndrome).
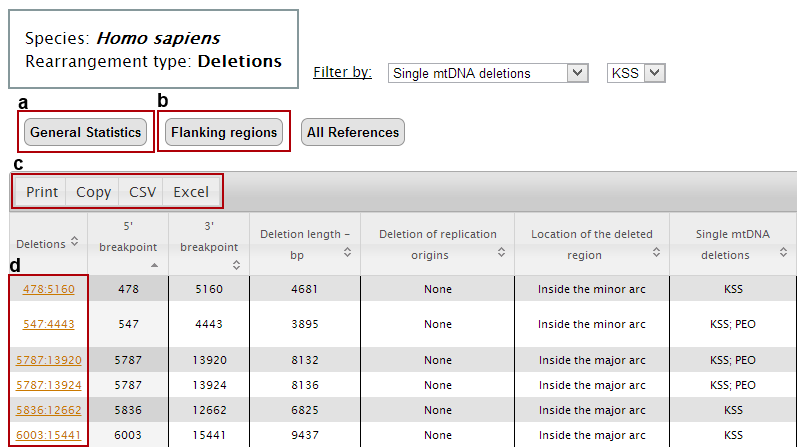
At this point the main table displays all deletions that were associated with Kearns-Sayre Syndrome.
Now we can:
a. get the general statistics for the selected group of rearrangements;
b. get the sequences of the breakpoint flanking regions;
c. print, copy or download all data (in csv or excel formats);
d. analyse each deletion individually.
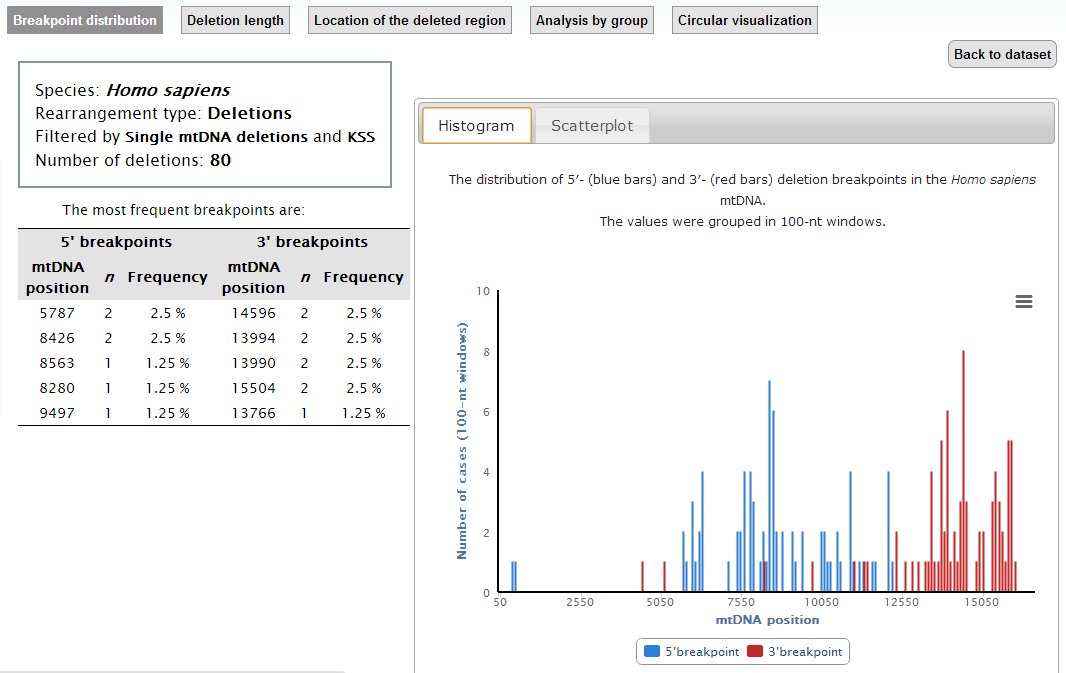
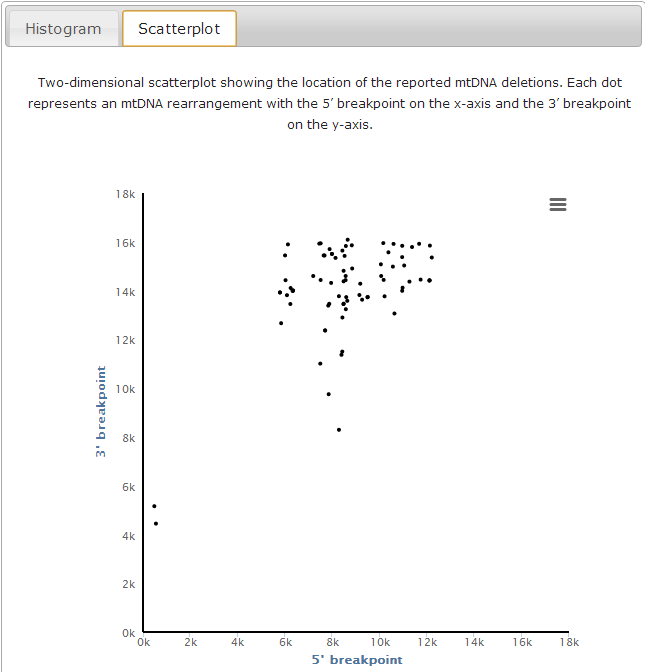
Clicking on the "General Statistics" button (a in previous image) you will access the 'General Statistics' page, which displays the 'Breakpoint distribution' analysis. In this page, you can see both the location and the frequency of the breakpoints in our filtered data (in histogram and scatterplot).
In the top menu of the "General Statistics" page, you have access to other statistics: "Deletion length", "Location of the deleted region", "Analysis by group" and "Circular visualization".
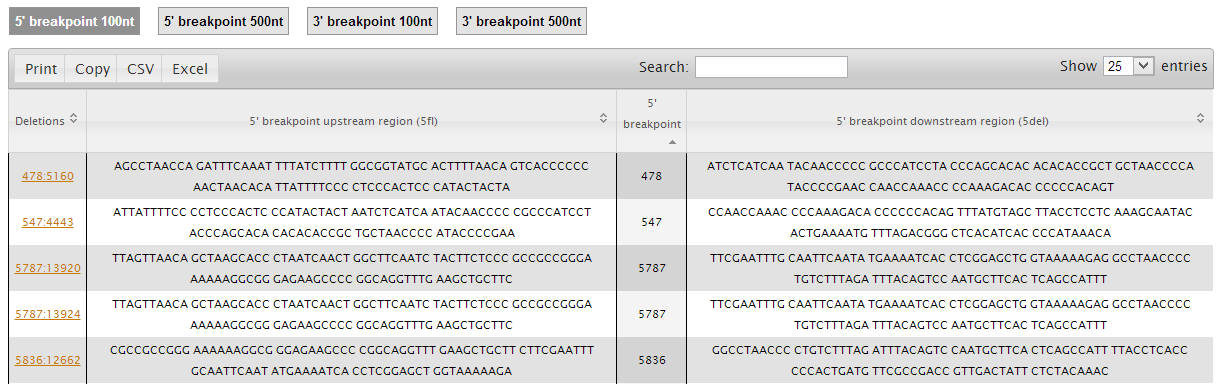
Clicking on the "Flanking Regions" button (captioned as b) you will access the 'Flanking Regions' page, which displays the sequences of the regions flanking the breakpoints. In this page, you can see and download the flanking sequences of the 5' and 3' breakpoints with 100 or 500nt length.
6. In order to get back to the 'Dataset page', click on 'Back to dataset' button in the top right of the "General Statistics" page.
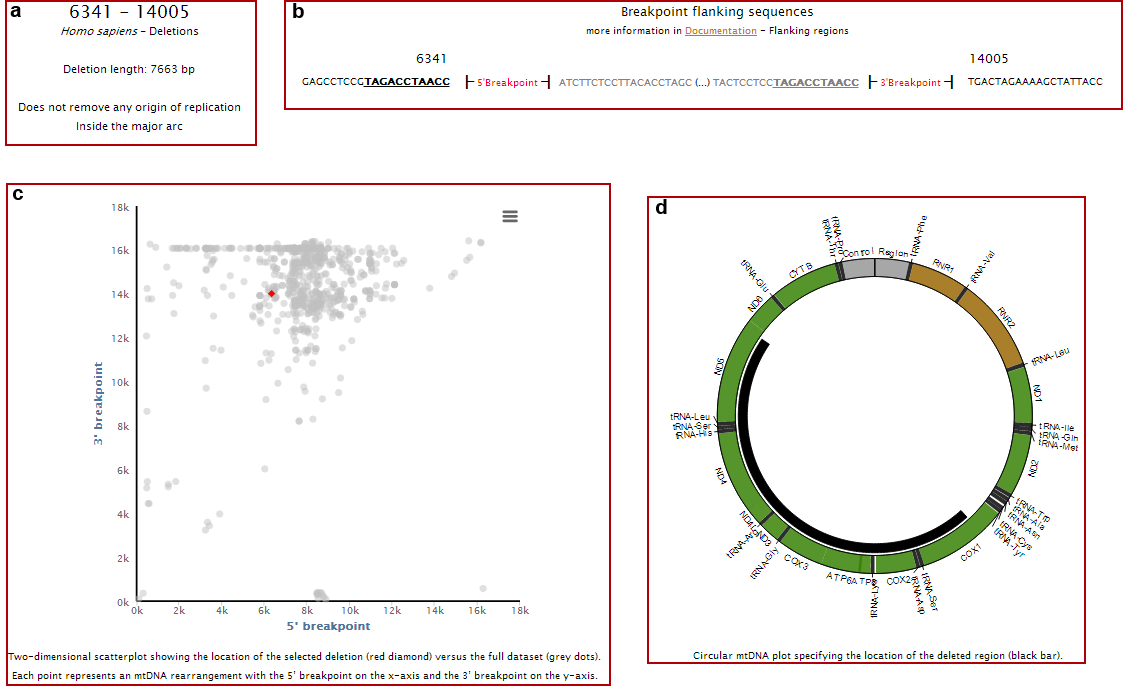
Clicking on the name of each individual deletion, you will access to its individual page, where you can see the:
a. Rearrangement length, if it removes any origins of replication and if it is located in the minor or major arc;
b. Breakpoints flanking sequences (showing both the deleted and non-deleted regions) and the presence of direct repeats (underlined nucleotides);
c. Location of 5’ and 3’ breakpoints in a 2D plot (red dot) as well as all other rearrangements present in our database (grey dots);
d. Location of the deleted region in a circular representation of mtDNA;
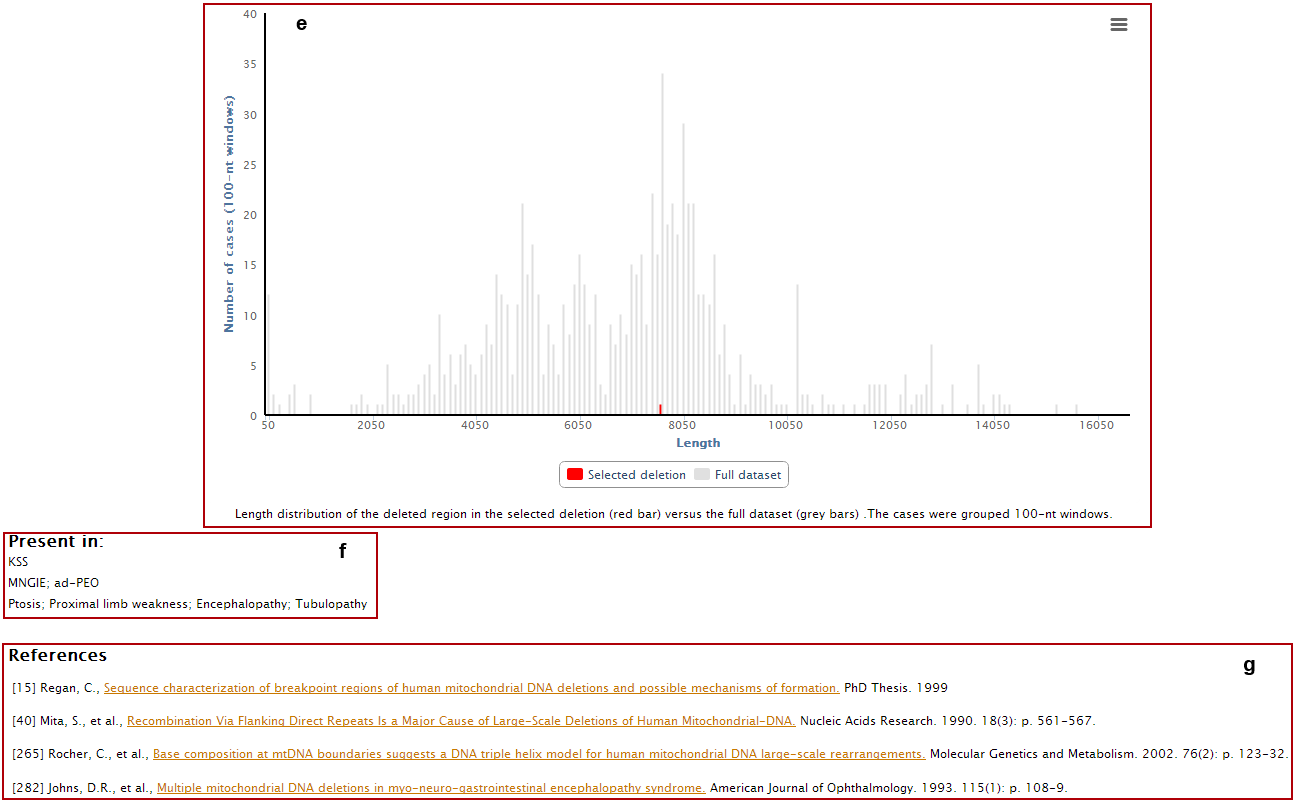
e. Deletion length (red bar) compared with the complete dataset (grey bars);
f. Clinical and phenotypic data associated with the deletion;
g. References where the deletion was reported.
Back to top
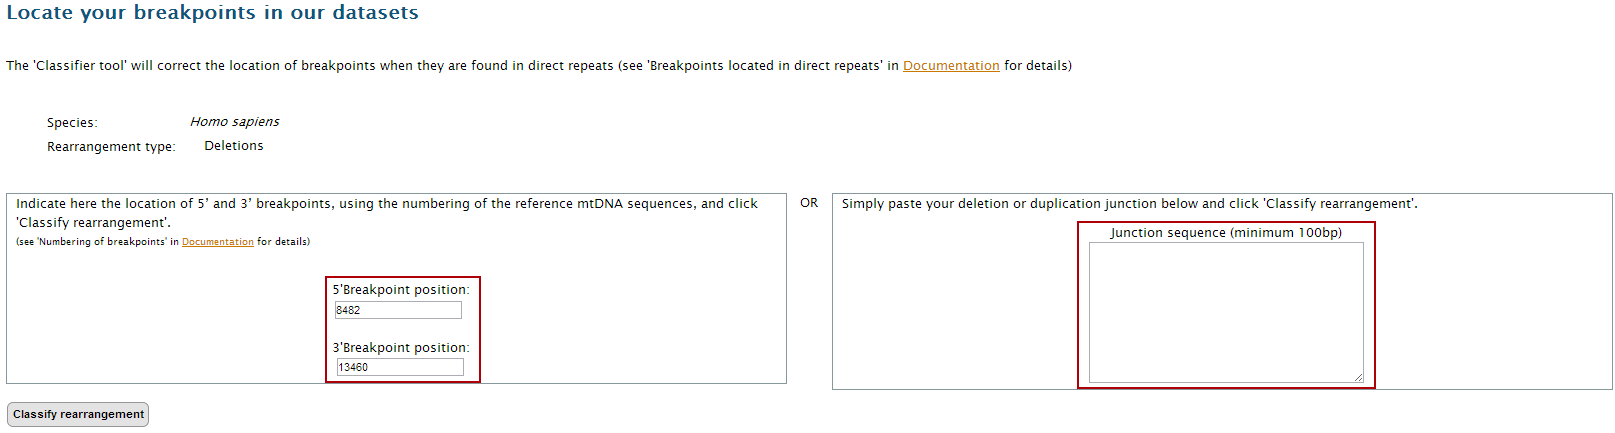
How to locate a pair of breakpoints within the existing datasets
Example –
Homo sapiens mtDNA deletion 8482:13460 (common deletion)
1. Go to
http://mitobreak.portugene.com/
2. Click on "Classifier" either on the top or bottom link bars.
3. Select the dataset representing your breakpoints or junction sequence to open the input page.
If you want to test the tool, use the given breakpoints or junction sequence. The fields will appear automatically filled.
4. Insert your data in the proper fields. Note that you can only input a pair of breakpoints (5’ and 3’) or a junction sequence. If you are using the breakpoint locations, don’t forget to consider the numbering of the reference of the mtDNA sequence. In our example, insert
5'breakpoint: 8482
3'breakpoint: 13460
5. Click on "Classify rearrangement".
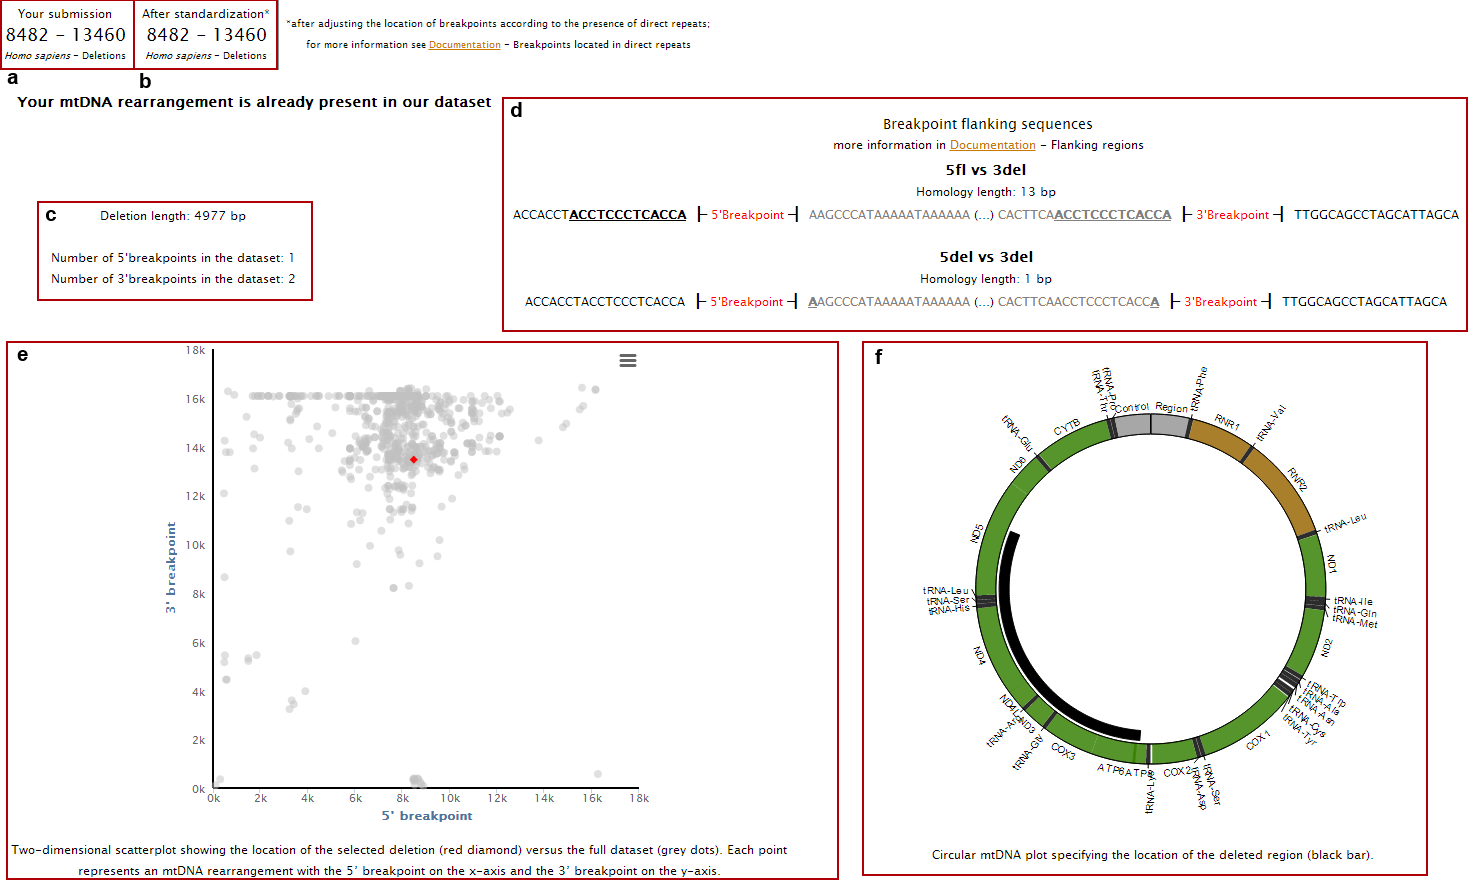
6.The page with the classification results will display:
a. Your input data;
b. Corrected breakpoint location;
c. Breakpoints flanking sequences (showing both the deleted and non-deleted regions) and the presence of direct repeats (underlined nucleotides);
d. Deletion length and frequency of the breakpoints in the database;
e. Location of 5’ and 3’ breakpoints in a 2D plot (red dot) as well as all other rearrangements present in our database (grey dots);
f. Location of the deleted region in a circular representation of mtDNA;
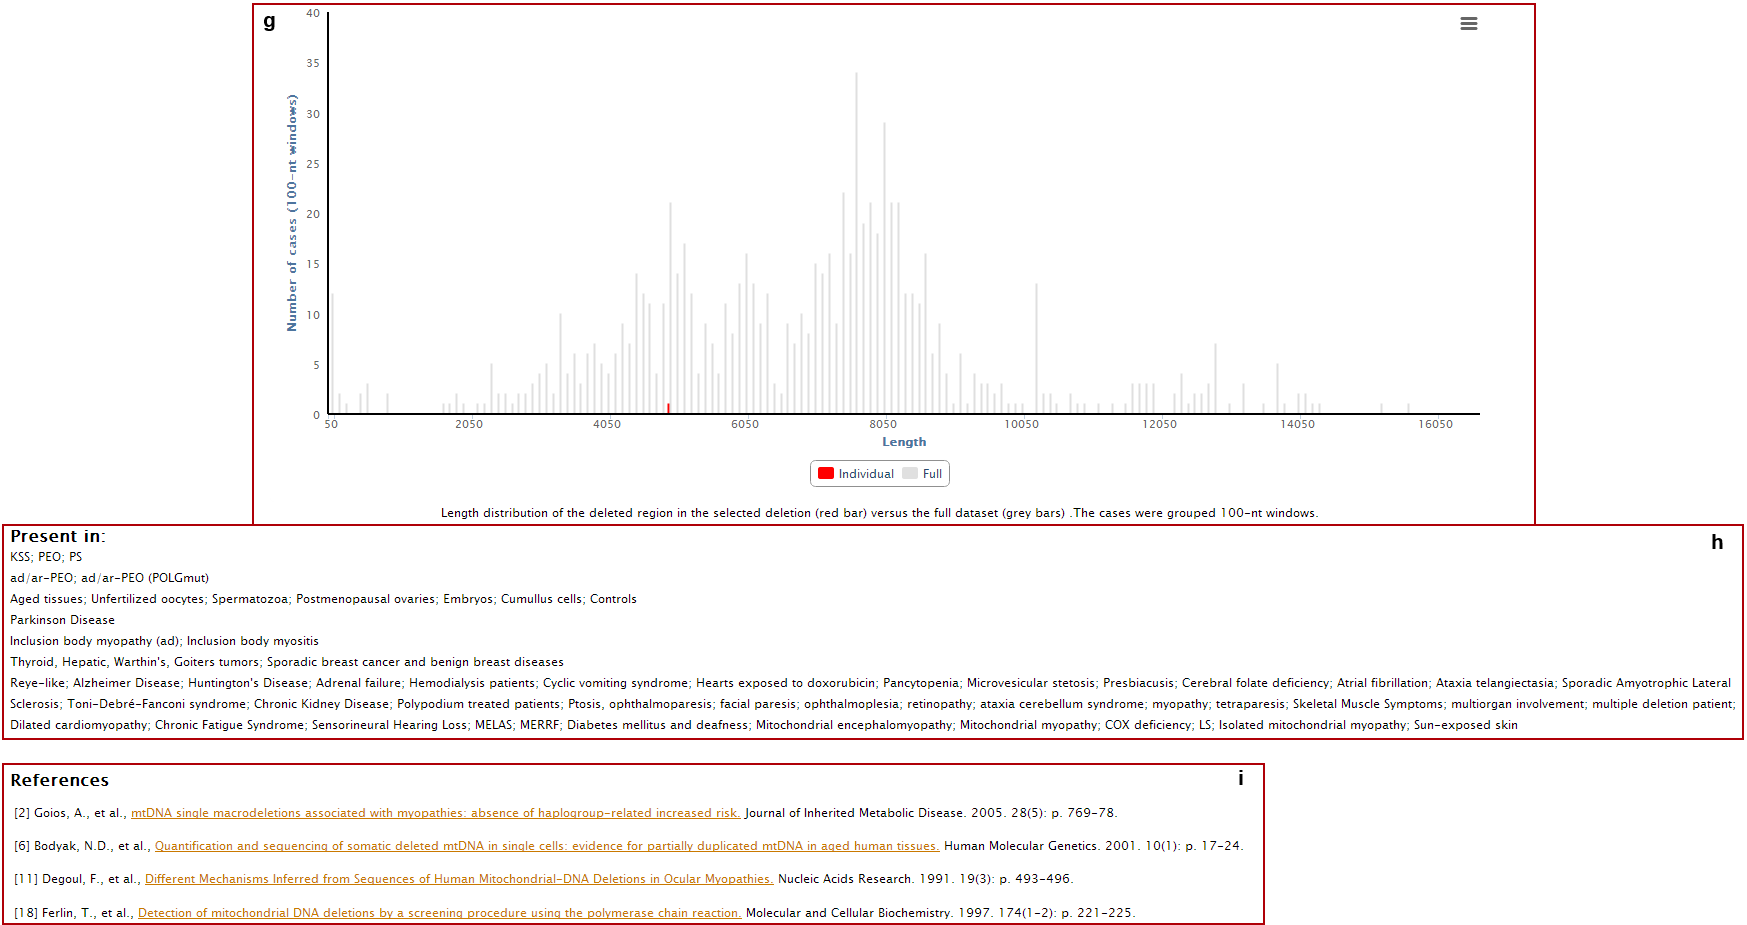
g. Deletion length (red bar) compared with the complete dataset (grey bars);
h. Clinical and phenotypic data associated with the deletion;
i. References where the deletion was reported.
Back to top
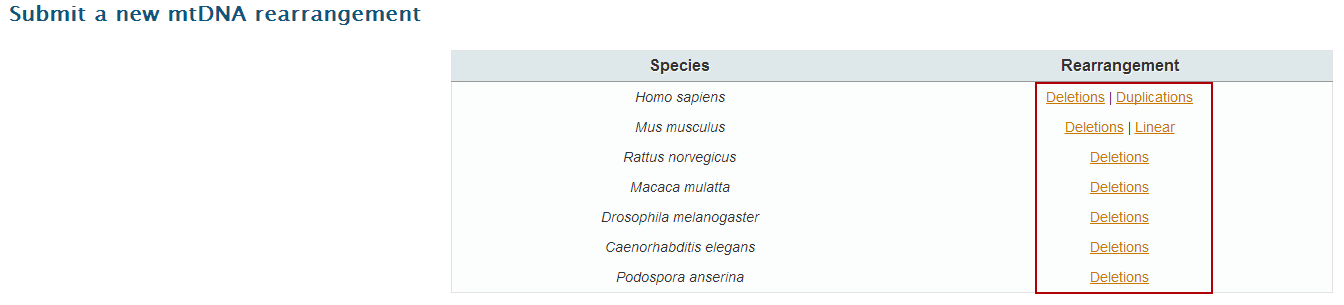
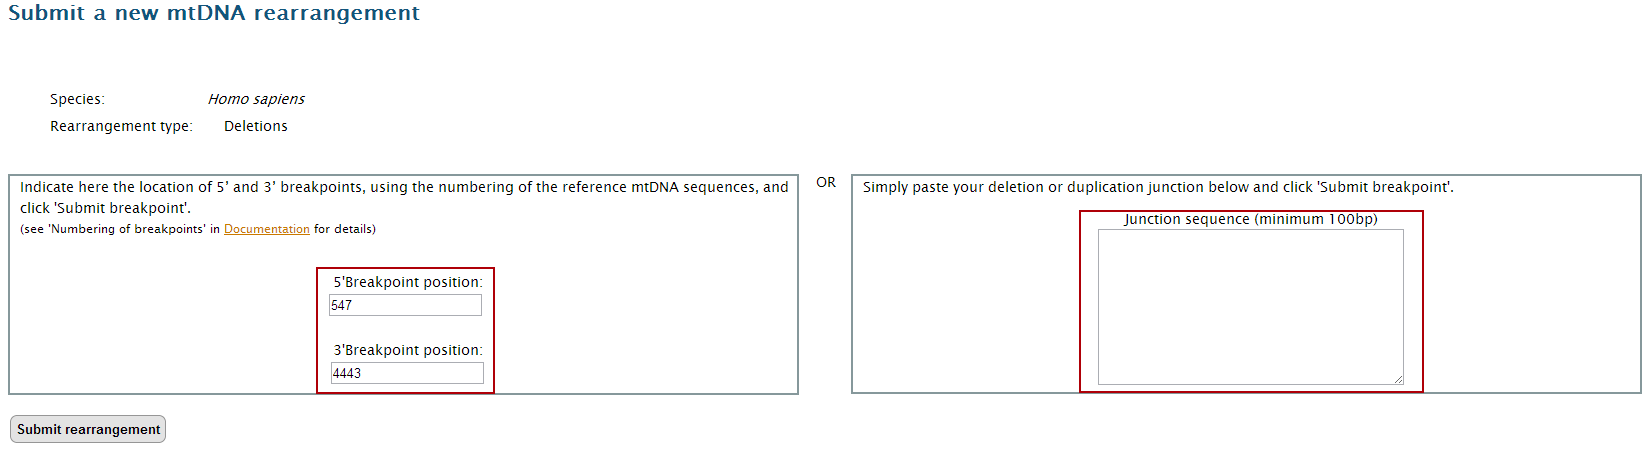
How to submit new breakpoints to the database
Example –
Homo sapiens mtDNA deletion 547:4443
1. Go to
http://mitobreak.portugene.com/
2. Click on "Submit" either on the top or bottom link bars
3. Select the corresponding dataset to open the input page.
If you have a large collection of rearrangements to submit or want to add breakpoints from a species and/or rearrangement type not present in MitoBreak, please
contact us.
4. Insert you data in the suitable place. Note that you can only input a pair of breakpoints (5’ and 3’) or a junction sequence. If you are using the breakpoint locations, don’t forget to consider the numbering of the reference of the mtDNA sequence. In this example we will use the pair of breakpoints 547:4443.
5. Click on "Submit breakpoint".
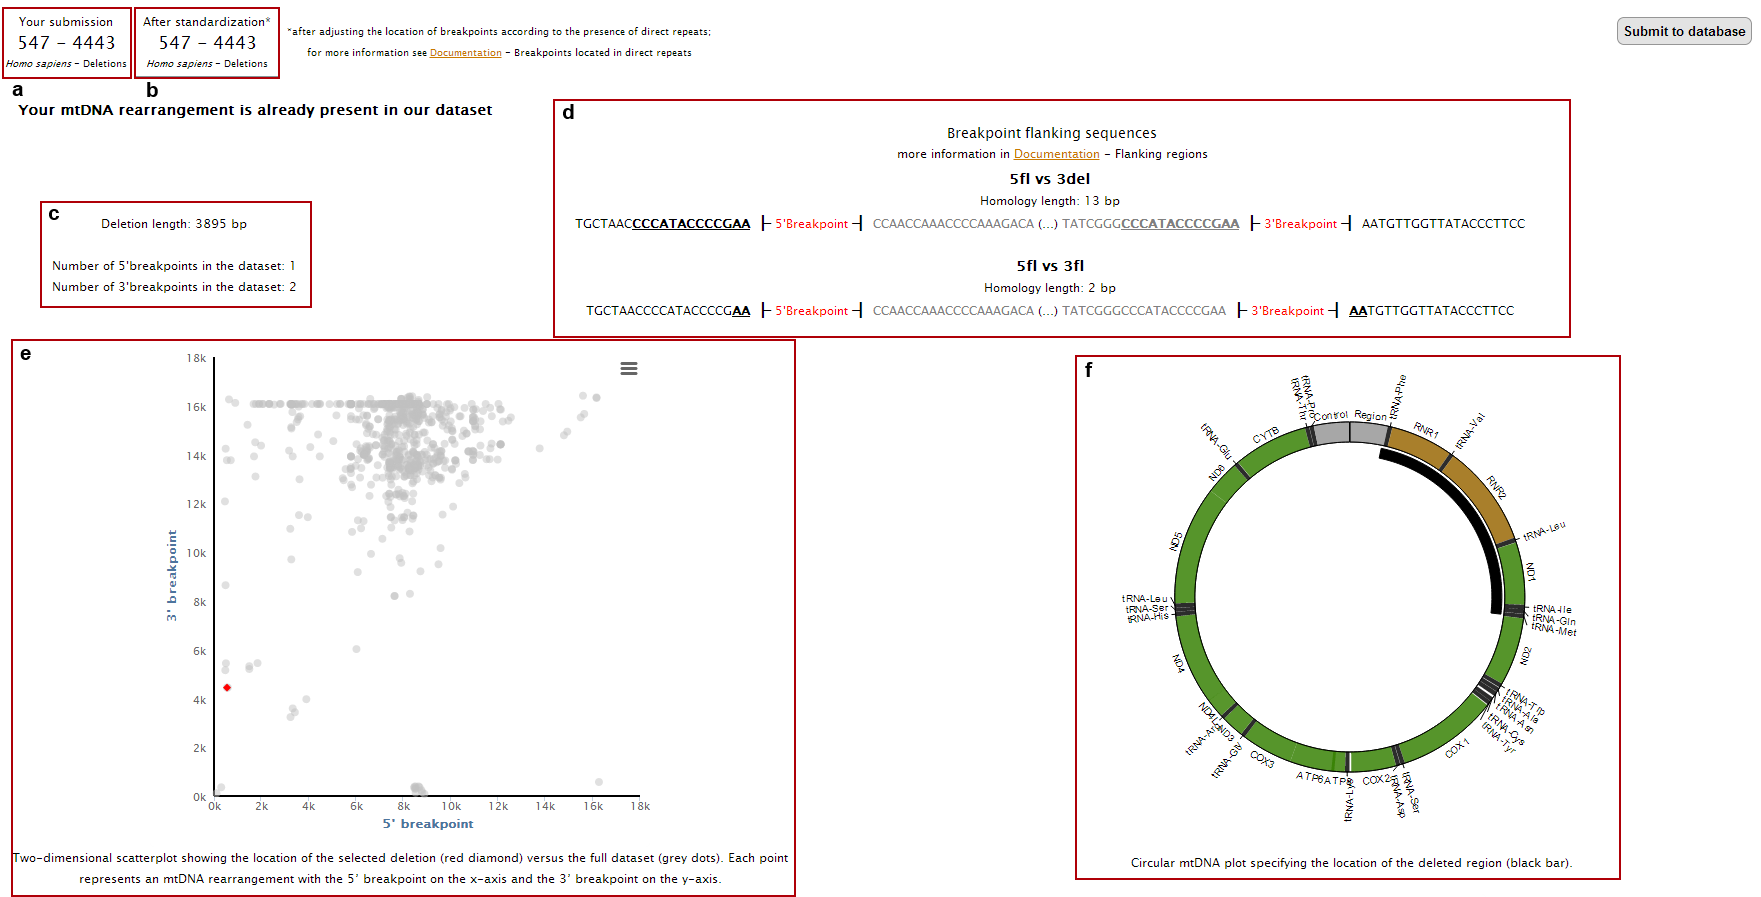
6.The page with the submission result will display:
a. Your input data;
b. Corrected breakpoint location;
c. Breakpoints flanking sequences (showing both the deleted and non-deleted regions) and the presence of direct repeats (underlined nucleotides);
d. Deletion length and frequency of the breakpoints in the database;
e. Location of 5’ and 3’ breakpoints in a 2D plot (red dot) as well as all other rearrangements present in our database (grey dots);
f. Location of the deleted region in a circular representation of mtDNA;
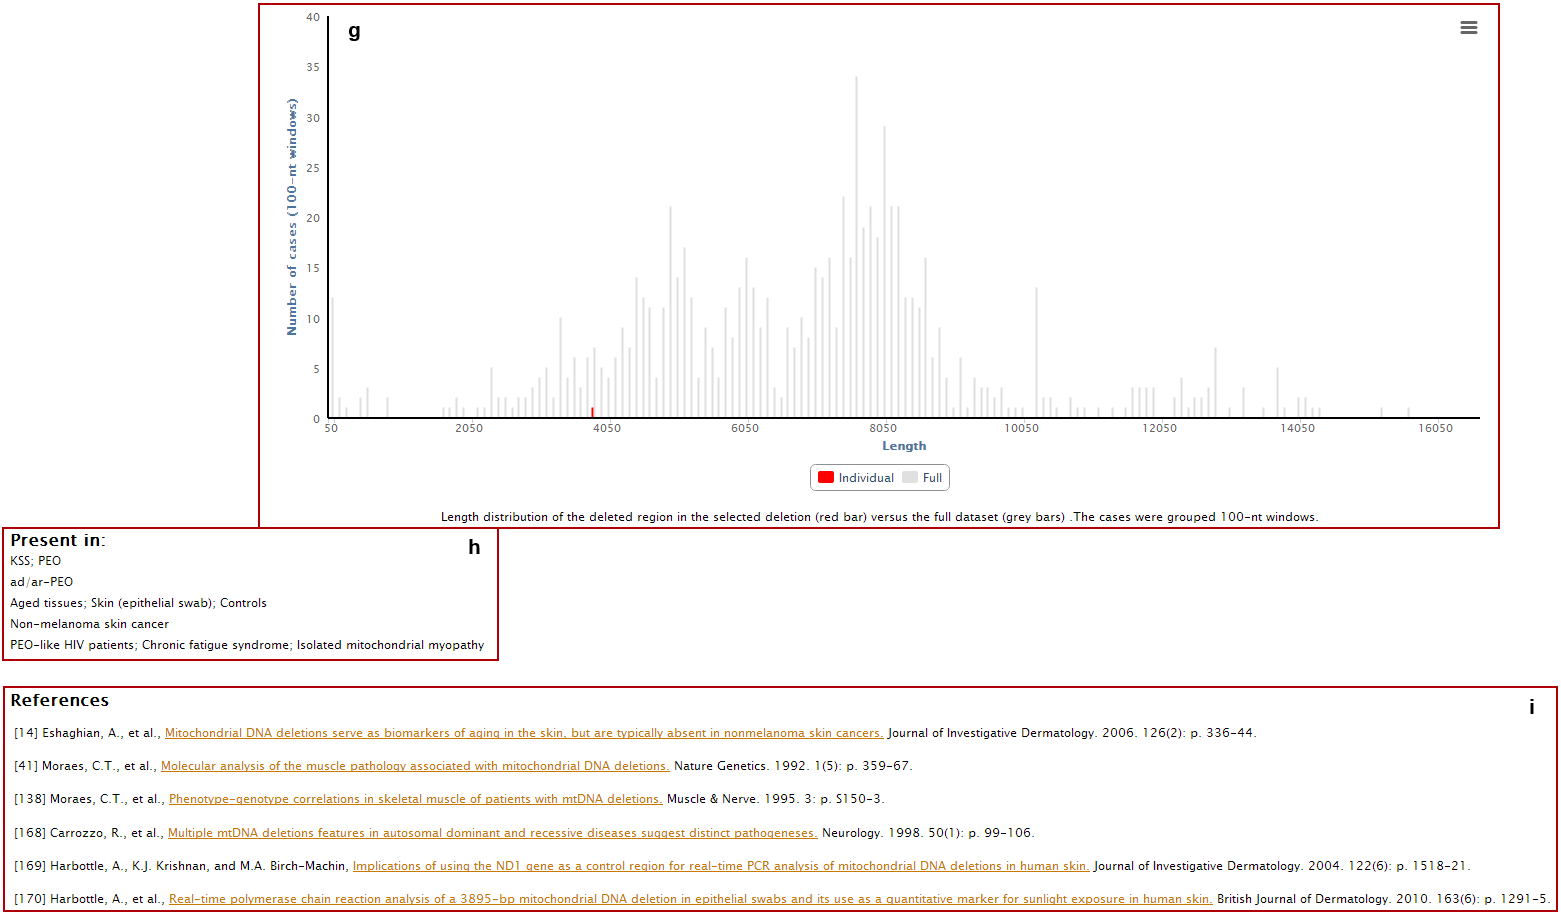
g. Deletion length (red bar) compared with the complete dataset (grey bars);
h. Clinical and phenotypic data associated with the deletion;
i. References where the deletion was reported.
7.After checking all the details of the rearrangement and verifying if it is already present in our datasets, click on "Submit to database".
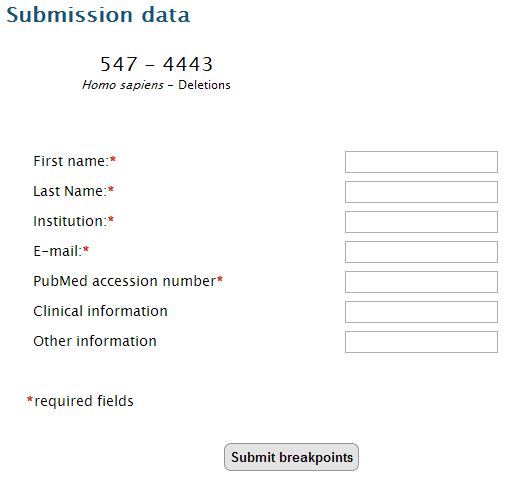
Select if your data was published or not, and fill the submission fields.
Click on "Submit breakpoints". You will receive a confirmation message after a successful submission. The rearrangement will be added to the database as soon as possible.
Back to top